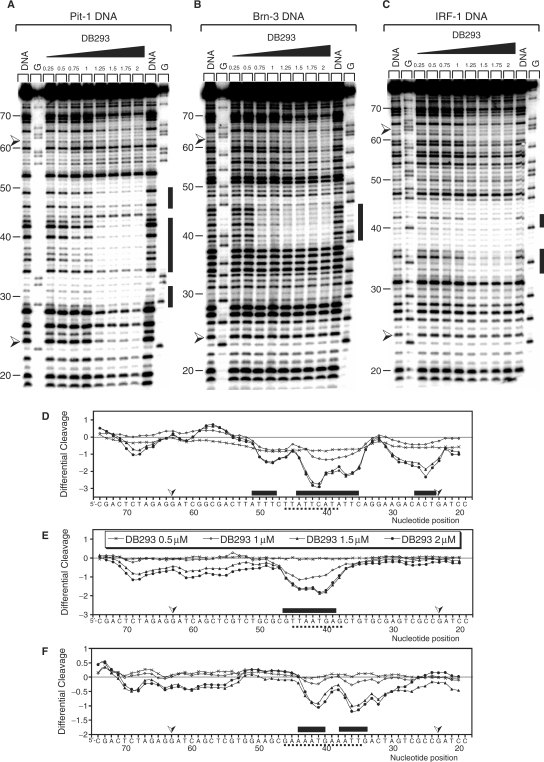
Figure 3.
DNaseI footprinting of DB293 on Pit-1, Brn-3 and IRF-1 consensus-binding sites. The concentration (µM) of the drug is shown at the top of the appropriate lanes. Control tracks labeled ‘DNA’ contained no drug. Tracks labeled ‘G’ represent dimethyl sulfate-piperidine-treated DNA sample exemplifying guanines location. The cloned sequences containing the various consensus-binding sites in the context of that used in the TranSignal DNA array approach are located between two arrows ( ). Pit-1 cloned site is inverted in comparison with that for Brn-3 and IRF-1 consensus-binding sites. The localization of the footprints is specified using black boxes on the gels (A–C) and on the respective densitometric analysis (D–F). The plots are expressed as the ln (0.5, 1, 1.5 or 2 µM) of DB293/control DNA alone.

