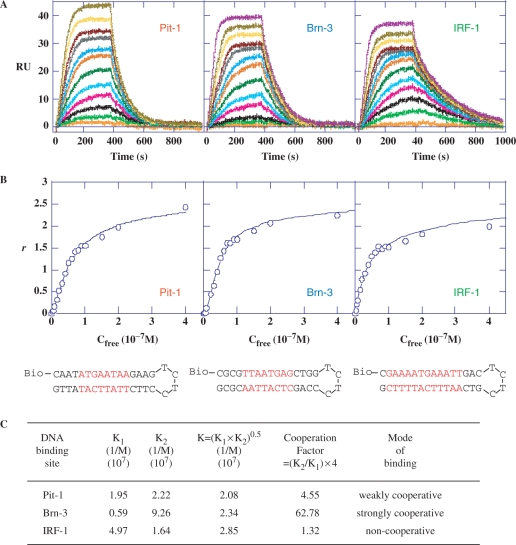
Figure 4.
SPR analysis of the DB293 interaction to the various transcription factors binding sites. (A) SPR sensorgrams for binding of increasing concentrations of DB293 (from 1 nM to 0.4 µM, bottom to top of the curves) to the minimal Pit-1, Brn-3 and IRF-1 consensus-binding sites within biotinylated hairpin oligonucleotides. (B) Binding plots derived from SPR sensorgrams used to calculate the affinity constants for DB293 bound to the various sequences (see Material and methods section). The sequence and structure of the DNA sequences used are presented at the bottom of the figures. The specific consensus-binding sites are specified in red. (C) Equilibrium constants for DB293 binding to Pit-1, Brn-3 and IRF-1 minimal consensus-binding sites. The deduced cooperativity factor is used to identify the potential cooperativity of DB293 molecules for DNA binding. A weak nonspecific binding that was a factor of 10–50-fold less than the strong consensus binding was also obtained but could not be accurately determined.

