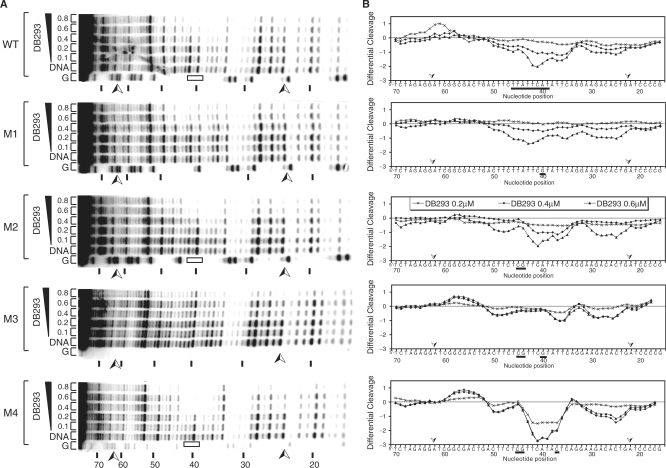
Figure 5.
DNaseI footprinting of DB293 derivatives on wild-type or mutated Pit-1 minimal consensus-binding site. (A) The WT or various mutated radiolabeled DNA fragments were incubated with the amount of drug specified (µM) prior to digestion by DNaseI. Lanes ‘DNA’ and ‘G’, arrows and blacks boxes are as described in Figure 3. Differential cleavage plots derived from the gels are presented in (B). White boxes localize the ATGA site on the gels. The mutated bases are underlined. Negative values correspond to a ligand-protected site and positive values represent enhanced cleavage.

