
Table 2.
Correlation between high-resolution improvement and its potential predictors
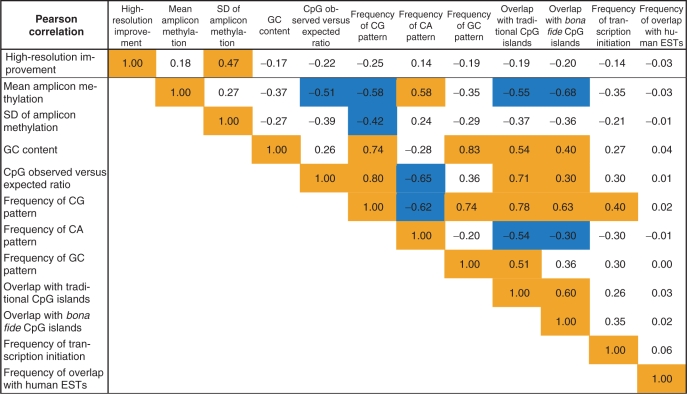 |
This table displays pairwise Pearson correlation coefficients for the accuracy improvement of high-resolution methylation mapping (first row) and several potential factors of influence. Orange (light) boxes mark strong positive correlation and blue (dark) boxes mark strong negative correlation.