Figure 5.
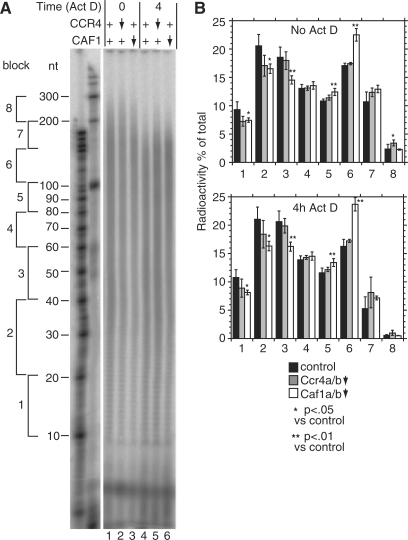
CAF1 depletion inhibits deadenylation in human cells. HTGM5 cells were transfected with siRNAs to deplete CAF1 or CCR4 (downward arrow) or with control siRNAs (+). The effect of the siRNAs on their targets is illustrated in Figure 6. Samples were taken either with, or without 4 h Actinomycin D treatment. Purified RNA was 3′-labelled then digested with RNases A and T1. (A) Phosphorimager image showing radiolabelled poly(A) tails separated by denaturing gel electrophoresis. To the left are the positions of markers. Further to the left we have indicated blocks of 20–50 A residues, as in Figure 5. (B) Quantitation of results from the gel shown in (A). For each individual lane, the amount of radioactivity each block was calculated relative to the total radioactivity in the lane. The results are expressed as arithmetic mean ± standard deviation. Black bars: control siRNA, five independent experiments; grey bars: Ccr4a+b-depleted, siRNAs C4+C8, three experiments; open bars: Caf1a+b-depleted, siRNAs C5+C6, four experiments. Upper panel: steady state, values for lanes 1, 2 and 3 (in that order); lower panel: after 4 h Actinomycin D, values for lanes 4, 5 and 6. P-values are for a 2-tailed students t-test (unequal variance) and show the probability that the poly(A) tail signals for Ccr4- or Caf1-depleted cells were the same as those of the control.

