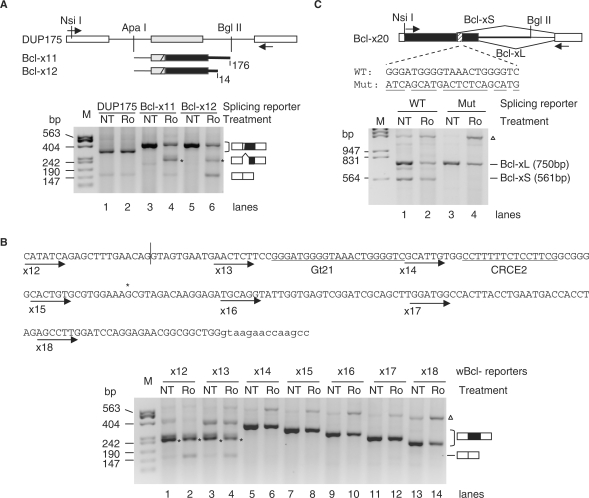
Figure 2.
A G-tract region in Bcl-x is essential for the Ro-induced reduction of the Bcl-xL product. (A) (Upper) Diagram of the control splicing reporter DUP175 and cloned inserts of the Bcl-x minigene splicing reporters. Boxes represent exons and lines introns. Black boxes represent the Bcl-xL exon and black heavy lines Bcl-x intron. In the Bcl-x constructs, 51-nt β-globin exon sequence was fused with the exon 2 of Bcl-x containing 20-nt Bcl-xS, the 189-nt Bcl-xL exons and different lengths (nt) of the downstream introns as indicated. ApaI and BglII are the cloning sites. The arrows indicate locations of PCR primers. (Bottom) An agarosel gel of RT-PCR products from HEK293T cells transfected with the splicing reporters (as indicated above the gel) and treated with Ro or without (NT). The spliced products are diagramed to the right of the gel. Gel representative of at least three samples for each lane. (B) (Upper) Bcl-x sequence included in wBcl-x12 and other reporters. Exon sequences are in upper cases and intron in lower cases. The vertical line marks the 5′ splice site exon–intron junction for Bcl-xS. The starts of the arrow lines indicate the Bcl-x insert starting positions in each splicing reporter minigene (with reporter numbers below the arrows). In these wBcl-x reporters, the upstream 3′ splice site of the middle exons was replaced with a weaker sequence (see Materials and methods section) for a stronger Ro effect. (Bottom) Similar to the gels in (A) except with different splicing reporters as indicated above the gel. The 21-nt G-tract region (Gt21) to be examined and the CRCE2 sequence required for ceramide-regulation of Bcl-x splicing is underlined. (C) Role of the G-tract region in Ro-induced Bcl-xL reduction in its alternative 5′ splicing context. (Upper) Diagram of the Bcl-x20 splicing reporter with the Bcl-x exon 2 (black box, including the 189-nt Bcl-xL sequence) and downstream intron (514 nt, heavy line) cloned between the Nsi I and Bgl II sites of DUP175. The splicing patterns and the wild-type and mutant (mutated nts underlined) sequences of the G-tract region are as indicated. Arrows: locations of PCR primers. (Lower) An agarose gel of the RT-PCR products from cells transfected with the splicing reporters without treatment (NT) or treated with Ro (Ro) as indicated above the gel, with molecular size markers to the left and splicing products (sizes) to the right. Cells were treated with 2 µg/ml Ro or nontreated (NT) for overnight. *Product from cryptic 3′ splice site as indicated to the right of the gels or the cryptic splice position in the sequence. Gel representative of two experiments; open triangle, product resulted from pre-mRNA or plasmid; M, molecular size marker (bp).

