Figure 5.
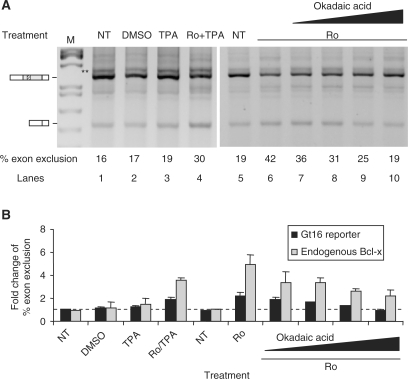
Okadaic acid inhibits Ro-regulation of alternative splicing through the G-tract element. Shown are agarose gels of RT-PCR products of DUP175AS-Gt16 reporter from HEK293T cells treated with or without (NT) chemicals as indicated above the gels (A), with the average percentages of the exon-excluded products indicated under each lane. Below (B) is a bar graph of fold changes (average ± SD, n ≥ 3, relative to the nontreated NT sample for each reporter, black bars) of the percentages of exon-excluded products for each lane. Similarly obtained fold changes of the percent exon exclusion of the endogenous Bcl-x (gray bars) from the same samples are also shown beside the bars for each reporter in the graph. The dotted line marks the NT sample level. Ro: Ro-31-8220 (2 µg/ml). DMSO: vehicle for TPA. The okadaic acid concentrations, from left to right, were 20, 100, 500 and 1000 nM. TPA concentration: 120 ng/ml. **Same as in Figure 4.

