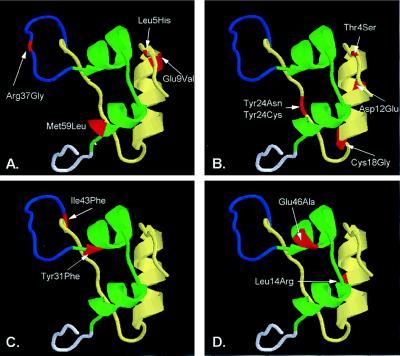
Figure 5.
IGF-1 mutants indicated on the three-dimensional structure of the IGF-1 molecule. The residues marked in red indicate the site of mutation; the domains of the IGF-1 molecule are indicated as follows: A, green; B, yellow; C, blue; and D, white. After random mutagenesis four groups of the mutants could be distinguished by the intensity of the blue color or β-galactosidase activity. (A) The strong interaction group. These mutants showed enhanced intensity of β-galactosidase reaction compared with native IGF-1. (B) The intermediate interaction group. This group of mutants did not affect the interaction with IGF-1 receptor. (C) The reduced interaction group. These mutants had significantly weaker color reaction and modestly reduced activity in the quantitative assay. (D) The negative interaction group. These mutants had completely lost ability to interact with the IGF-1 receptor in the yeast two-hybrid assay.

