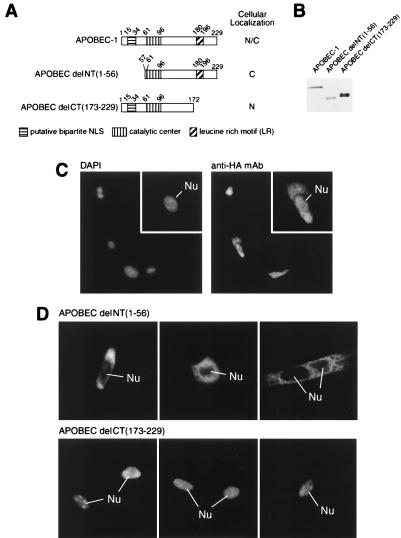
Figure 1.
Structure and subcellular localization of APOBEC-1 and deletion mutants. (A) The diagram of each construct and the corresponding domains are drawn in scale with a summary of their intracellular distribution. (B) An equivalent number of cells from the corresponding transfections were analyzed by Western blotting. Note that the C-terminal deletion mutant migrated slower than expected for its predicted molecular mass. (C) DAPI-stained nucleus and anti-HA mAb-stained HA-APOBEC-1 in transiently transfected McArdle cells. Insets show a high magnification of one of the transfected cells. Nu, nucleus. (D) The N- or C-terminal deletion mutants were localized in McArdle cells by indirect immunofluorescence microscopy. Three representative fields are shown for each transfected construct.

