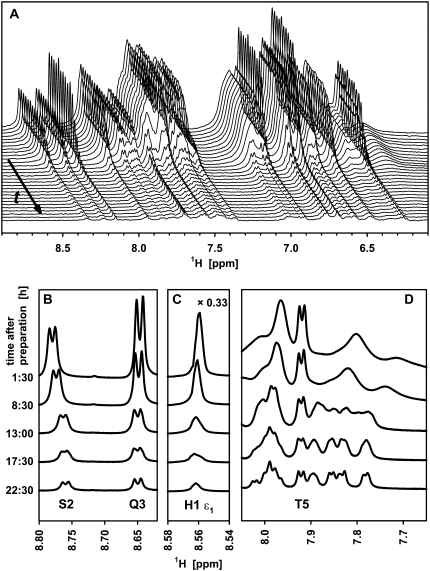
FIGURE 2.
Excerpts from series of 1D 1H liquid-state NMR spectra of glucagon monitored during fibril formation. (A) Amide (8.6–7.7 ppm) and aromatic/amino region (7.5–6.3 ppm) from 0 to 35 h in steps of 75 min after sample preparation (from back to front). The frequency axis refers only to the first (upper) spectrum at 0 h; the subsequent spectra contain offsets in both dimensions to enhance visibility. (B–D) Excerpts exploring spectral changes for the peaks of Ser-2 and Gln-3 (B), His-1 ɛ1 (C), and the upfield part (D) of the amide region during the ramp phase. (A) The spectra was recorded at 400 MHz using a 3.5-mg/mL sample of glucagon. (B–D) The spectra in were reproduced at 700 MHz using a 7.0-mg/mL sample.

