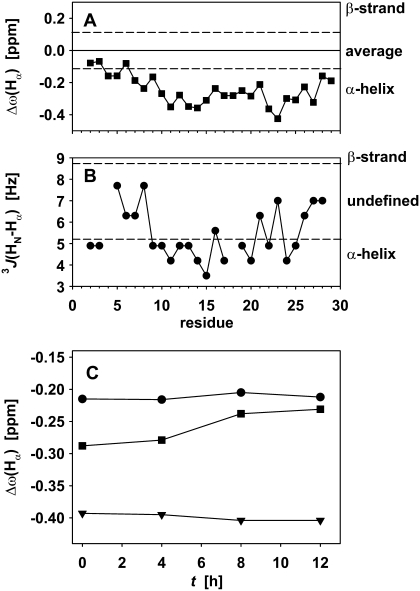
FIGURE 8.
(A) Secondary chemical shift, as the difference of the frequency of the Hα proton to the random coil average value for the amino acid type, for 7.0 mg/mL glucagon. (B) J coupling between amide and α-proton. Dashed lines show the generally accepted limits for the different secondary structure elements in A and B. (C) Development of the secondary chemical shift of the observed signals over the ramp phase of fibril formation. Ser-8 (dots), Leu-14 (triangles), and Gln-20 (squares).

