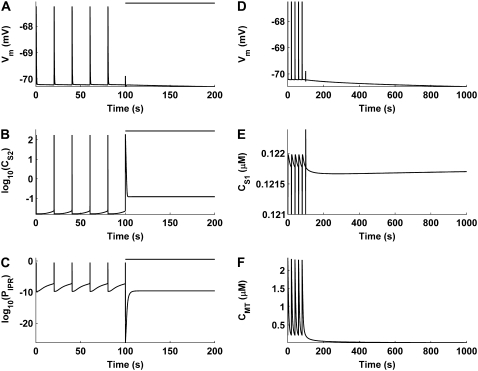
FIGURE 9.
Numerical simulations showing the short-term (A–C) and long-term (D–F) effects of mitochondrial inhibition on pacemaker activity. The bar above the traces in A–C denotes MCU inhibition. UP depolarizations, which are present before MCU inhibition, are abolished after MCU block (A). This appears to be due to a build-up in CS2 (B) which prevents the IP3R from returning to a susceptible state (C). Long-term simulation, after pacemaker activity cessation, shows membrane hyperpolarization (D) caused by a transient increase in CS1 (E). The increase in CS1 is due to the emptying of mitochondrial Ca2+ stores over time (F). Note that logarithmic values are plotted for the CS2 (B) and PIPR (C) traces, and that the y axis on CS1 trace (E) is truncated at 0.121 μM.

