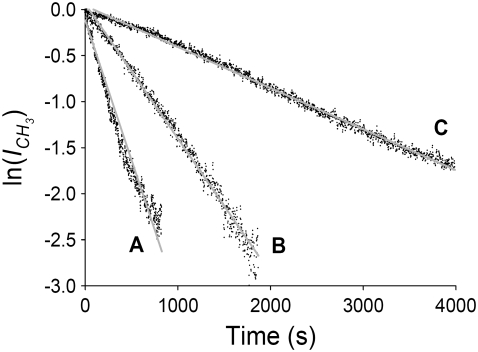
FIGURE 4.
Sample pressure-dependent SFVS CH3 vs intensity decays measured at 2876 cm−1 for asymmetric DPPC/DPPC-d62 bilayers recorded at 37°C. Raw data is shown as black points, with the fit to the data shown in a shaded line for samples prepared at deposition pressures of 28 mN/m (A), 37 mN/m (B), and 40 mN/m (C).

