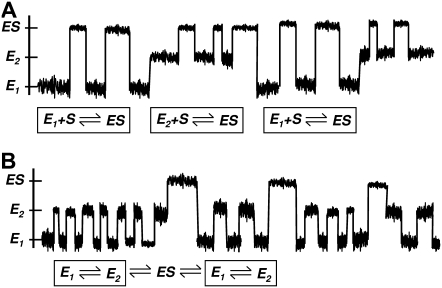
FIGURE 4.
Schematic plots illustrating the dynamical difference between slow and rapid fluctuating states E. In the former, the enzyme substrate associations occur in serial order (A), while in the latter, they are in parallel. The overall association is determined by the average time in panel A but average rate in panel B.

