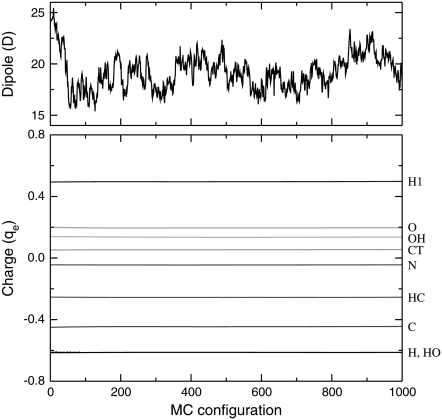
FIGURE 9.
Variations of the instantaneous electric dipole moment (upper panel) and average individual charges (lower panel) versus Monte Carlo configuration, as taken periodically along a 200 K trajectory of helical octa-alanine. The atomic charges are identified by their AMBER type, as indicated on the right of the panel.

