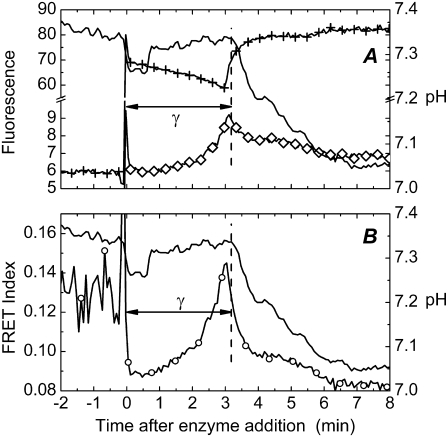
FIGURE 2.
Time course for FRET between PLA2D and PLA2A during hydrolysis of DPPC liposomes. (A) Emission of PLA2A at λ = 600 nm (⋄) upon excitation at λ = 460 nm of PLA2D. Emission of PLA2D at λ = 520 nm (+) upon excitation at λ = 460 nm. (B) Relative FRET efficiency (○) calculated according to Eq. 3. Conditions were as described for Fig. 1, except for using 32.5 nM of PLA2D and PLA2A each. The vertical dashed line marks the burst in activity, with pH shown as solid lines.

