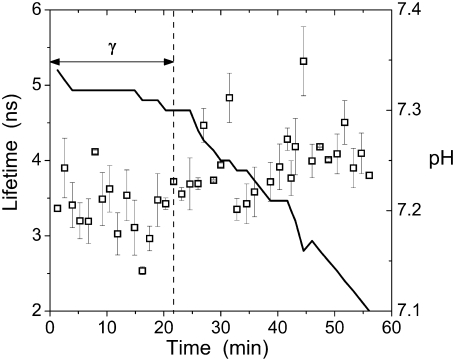
FIGURE 4.
Fluorescence lifetimes τ for PLA2A (□) monitored in the course of the enzyme action on DPPC liposomes. To prolong the lag time γ in this experiment, the reaction was carried out at 36°C. Final lipid and protein concentrations were 200 μM and 75 nM, respectively, in 2 mM CaCl2. Changes in pH are indicated with a solid line.

