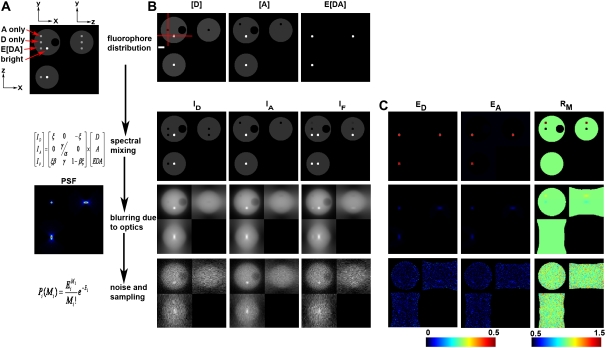
FIGURE 1.
Model of 3D-FRET data. (A) A model of a 4.5-μm-diameter yeast cell with three distinct distributions of donor ([D]), acceptor ([A]), and donor-acceptor complex times FRET efficiency (E[DA]) was generated. (B) Spectral mixing of fluorescence from each fluorescent species (via multiplication with matrix A) gave rise to the fluorescence distributions detected in each imaging channel. These spectral mixtures were blurred by the imperfect detection of the optical microscope (e.g., multiplication with matrix P). Here, blurring was modeled using a PSF simulated for the widefield epifluorescence microscope. To simulate detection noise, the blurred distributions were used as expected values E to obtain measured value M from a Poisson distribution. Asymmetric 3D data acquisition (resulting voxel dimensions were 67 nm, 67 nm, 201 nm) was simulated by resampling the model simulated after convolution. (C) The apparent FRET efficiencies EA (E[DA]/A) and ED (E[DA/D]) and the molar ratio RM ([A]/[D]) were calculated from the corresponding rows of images to demonstrate the impact of spectral mixing, blurring, and noise on the resolution of the apparent FRET efficiencies and RM images. Red lines in B indicate the axes used for making the xz and xy slices. The xy slice was taken from the central plane. Scale bar is 1 μm.

