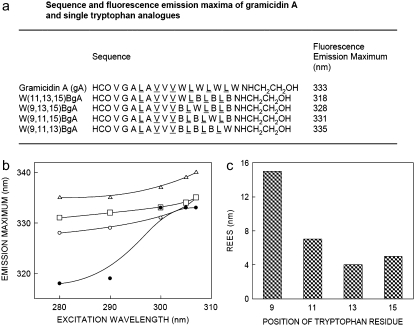
FIGURE 1.
(a) Amino acid sequence and fluorescence emission maxima of gA and the single-tryptophan analogs used (B denotes Ser-t-butyl). Alternating d-amino acid residues are underlined. The excitation wavelength was 280 nm and the data for gA is from Rawat et al. (28). (b) Effect of changing excitation wavelength on the wavelength of maximum emission for W(11,13,15)BgA (•), W(9,13,15)BgA (○), W(9,11,15)BgA (□), and W(9,11,13)BgA (Δ) in POPC membranes. It should be noted that the lines joining the data points are provided merely as viewing guides. (c) The magnitude of REES obtained for the single-tryptophan analogs of gramicidin. The magnitude of REES corresponds to the total shift in emission maximum when the excitation wavelength is changed from 280 to 307 nm, shown in (b). The concentration of POPC was 0.85 mM. The peptide/POPC ratio was 1:50 (mol/mol). See Materials and Methods for other details.

