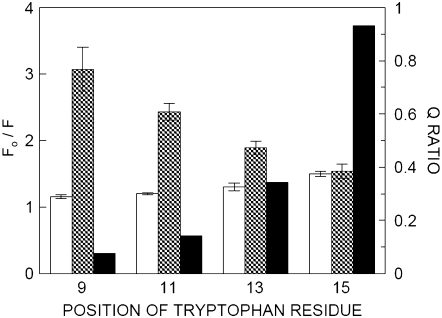
FIGURE 4.
Quenching and Q-ratios of tryptophan fluorescence of gramicidin analogs in POPC membranes. Fo is the fluorescence intensity in the absence of quencher (acrylamide or 10-DN), and F is the fluorescence intensity in the presence of quencher (acrylamide or 10-DN). The open bars represent quenching by 0.3 M acrylamide, and the hatched bars represent quenching by 10 mol % 10-DN. Data shown represent mean ± SE of at least three independent measurements. For acrylamide quenching, the excitation wavelength was fixed at 295 nm and emission was monitored at 334 nm in all cases. For 10-DN quenching, the excitation wavelength was fixed at 295 nm and emission was monitored at 334 nm except in the case of W(11,13,15)BgA, where emission was monitored at 320 nm. The filled bars represent Q-ratios calculated according to Eq. 1. The concentration of POPC was 0.11 mM. All other conditions are as in Fig. 1. See Materials and Methods for other details.

