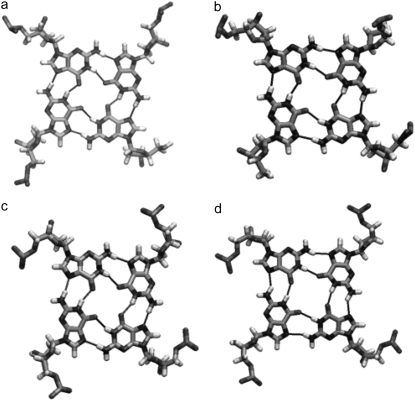
FIGURE 11.
The G-tetrad geometries of (a) the 3′ terminal G-tetrad in the parallel-stranded propeller-loop crystal structure, (b) the 45-mer, (c) the 45-mer + BSU6039, and (d) the 93-mer. For (b–d) these are the averaged G-tetrads for each structure, averaged over the 15 ns simulation times. The thin black lines indicate hydrogen bonding arrangements.

