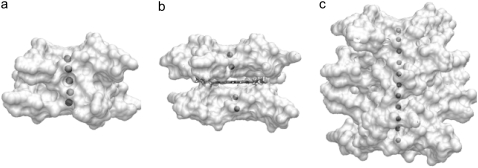
FIGURE 13.
Time-averaged structures from the 15 ns simulations, highlighting the position of K+ ions within (a) the 45-mer, (b) the 45-mer + BSU6039, and (c) the 93-mer. Each quadruplex is shown in solvent-accessible surface representation, with views into the central channel, and the ions colored gray.

