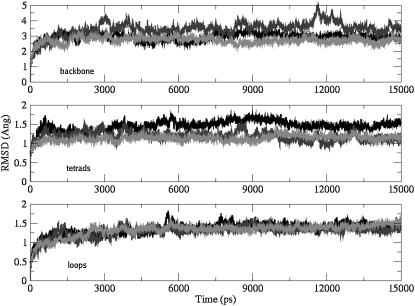
FIGURE 4.
Rmsd plots comparing different subsegments between models. Backbone atoms (top), G-tetrads (middle), and TTA loops (bottom). The pattern of stability observed between different subsegments is consistent with model 4 (93-mer; light gray) being most stable, followed by model 3 (45-mer + ligand; dark gray) and then model 1 (45-mer; black).

