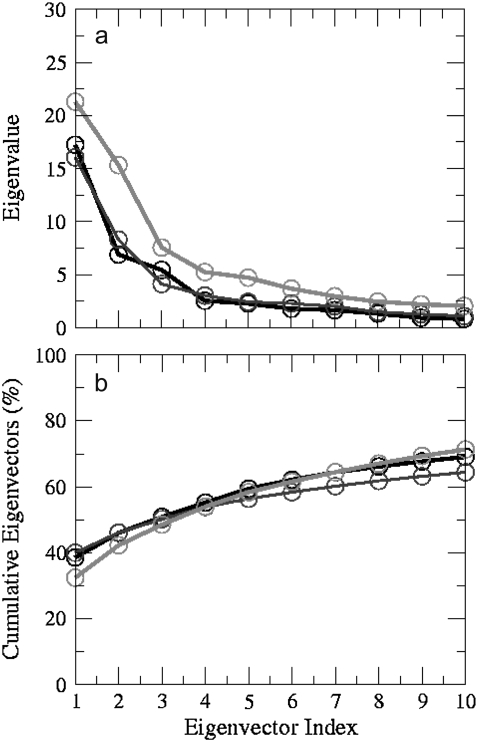
FIGURE 8.
(a) Eigenvalue versus eigenvector index (10 nm2) and (b) cumulative eigenvalues (%) derived from principal components analysis of trajectories of all atoms for the first 10 eigenvectors of model 1 (black), model 3 (dark gray), and model 4 (light gray) simulations. The concerted motion specified by first five eigenvectors can account for ∼60% of the overall motion.

