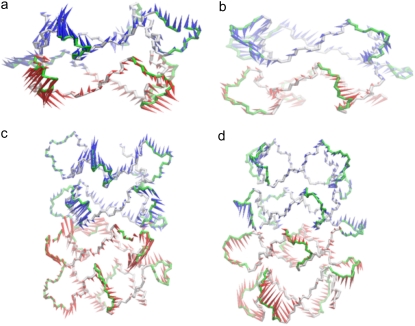
FIGURE 9.
Porcupine plots of the (a) first and (b) second eigenvectors for simulation of model 1 and (c) first and (d) second eigenvectors for simulations of model 4. The models are shown as a backbone trace. The arrows attached to each backbone atom indicate the direction of the eigenvector and the size of each arrow shows the magnitude of the corresponding eigenvalue. Each 21-mer unit is colored in an alternating fashion of red and blue. The motion in eigenvector 2 is opposite to that observed in eigenvector 1. The arrows summarize the direction of motion of the loops.

