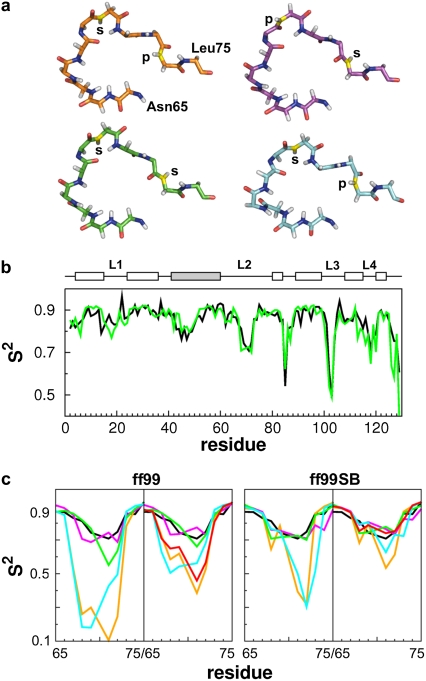
FIGURE 1.
(a) Residues 65–75 (loop 2) of the investigated HEWL structures (1HEL (orange, cluster 1); 1E8L model 1 (cyan, cluster 1); 1IEE (green, cluster 2); and 6LYT (magenta, cluster 4)). The N atoms of Gly71 and Asn74 are colored in yellow. Additionally, it is indicated if the N-H bond points to the protein (p) or to the solvent (s). (b) Experimental S2 values (18) (black) are compared to calculated values (green) from the 30 ns simulation of 1IEE with ff99SB. Secondary structure elements are indicated by boxes (white, helix; gray, β-sheet). (c) Comparison of experimental (18) (black) and calculated S2 values (colored as in a) of loop 2 using ff99 and ff99SB. The S2 values were either calculated over the whole 30 ns trajectory (left panels) or averaged over time windows of 1 ns length (right panels). The red line depicts 1 ns time window-averaged S2 values of 1HEL over 100 ns.

