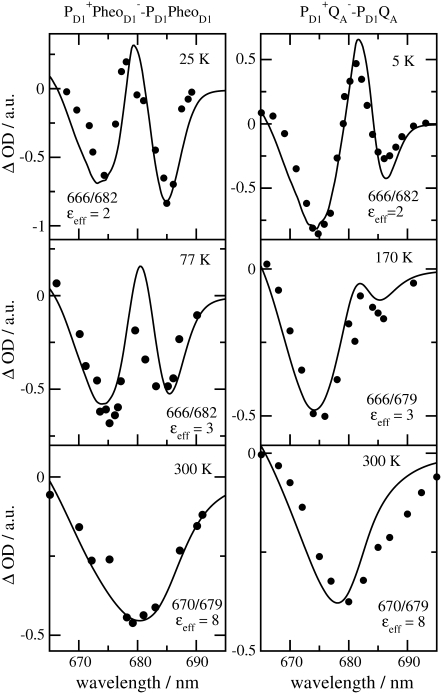
FIGURE 8.
Temperature dependence of the  (left half) and the
  (right half) spectra of T. elongatus. The calculations (solid lines) are compared with experimental data (solid circles) (21). The temperature-dependent wavelengths corresponding to the site energies of PD1 and ChlD1 (PD1/ChlD1) and the dielectric constants (εeff) are shown as well at each temperature.

