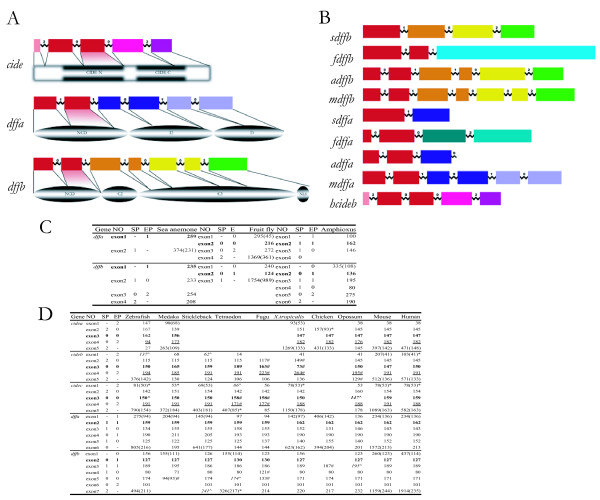
Figure 3.
Genic structures and intron phases of Cide and Dff gene family. (A) The gene structures of human Cideb, mouse Dffa and mouse Dffb are shown above their corresponding proteins. Exons and introns are shown in boxes and wavy lines, respectively [4, 17]. Exons are drawn to scale. Black lines link a particular exon to its translated region of the protein. The matching areas flanked by black lines between the most conserved proteins sequences and their corresponding exons are makred in red. (B) Genic structures and intron phases of Cide and Dff gene family from several representative model organisms are drawn to scale. The regions from the various species in the same color share sequence homology. (C, D) The genic and intron phases of Cide and Dff gene family are divergent in invertebrates but conserved in vertebrates. Exon sizes in different organisms are shown in evolutional order. The bordering intron phases of the exons are shown in the left. The number in '()' of exon 1 of each gene indicates its nucleotide position downstream of ATG (inclusive of the three nucleotides). The number in '()' of each last exon indicates its nucleotide position upstream of its stop codon. '*' indicate before the first exon (or after the last exon) noncoding exon regions. '#' refers to exons with deviational start phase and the end phase from the others in the same exon group. '^' indicates discard of some flanking exons. Italicized numbers are adjusted exon sizes. Exons in bold encode the most conserved protein regions. Abbreviations for species: s, sea anemone (Nematostella vectensis); f, fruit fly (Drosophila melanogaster); a, amphioxus (Branchiostoma floridae); m, mouse (Mus musculus); h, human (Homo sapiens). Other model organisms are zebrafish (Danio rerio), medaka (Oryzias latipes), stickleback (Gasterosteus aculeatus), tetraodon (Tetraodon nigroviridis), fugu (Takifugu rubripes), X.tropicalis (Xenopus tropicalis), chicken (Gallus gallus), opossum (Monodelphis domestica). SP, start phase, EP, end phase.

