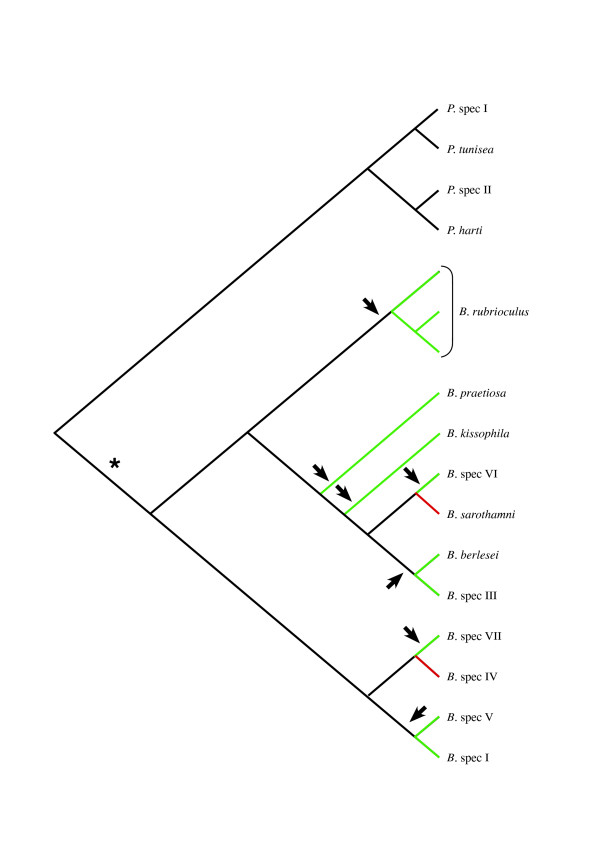
Figure 5.
Origins of asexuality. Cladogram of the 28S tree of Figure 3 showing the relationships between asexual and sexual Bryobia species. Green and red branches indicate asexual and sexual species respectively. Black arrows indicate the minimum number of times asexuality has originated (note that the actual origin of asexuality might occur anywhere along the indicated branch). A single origin of asexuality at * requires at east two reversals to sexuality (red branches).

