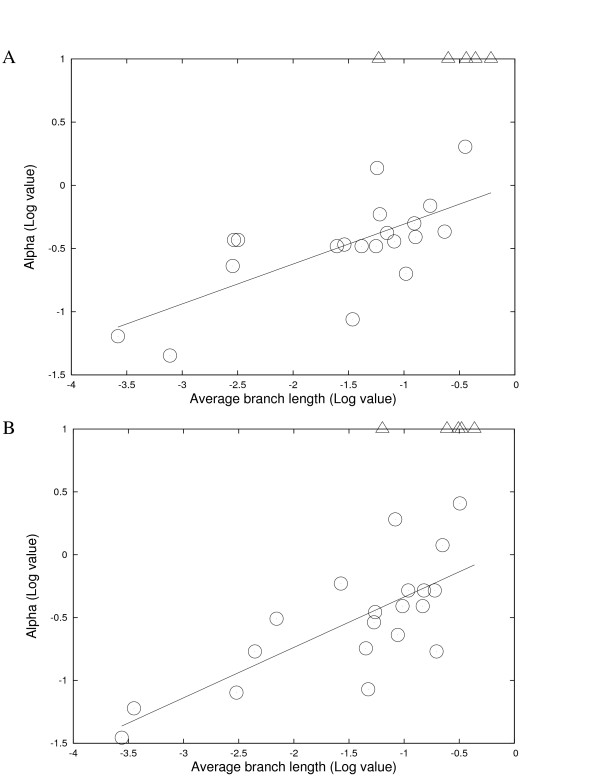
Figure 3.
Average branch length and optimized α in a Γ distribution in each different group. The five groups with an infinite α value are shown in open triangles. They were not used for estimating the regression lines. A, Estimation was based on the select-genes trees, y = 0.316x + 0.009 (R2 = 0.480, P ≃ 0.0007); B, Estimation was based on the common-genes trees, y = 0.401x + 0.064 (R2 = 0.562, P ≃ 0.0001).

