
Figure 5. Regulation of Adhfe1 Transcript in 3T3-L1 Adipocytes by PI 3-kinase Pathway.
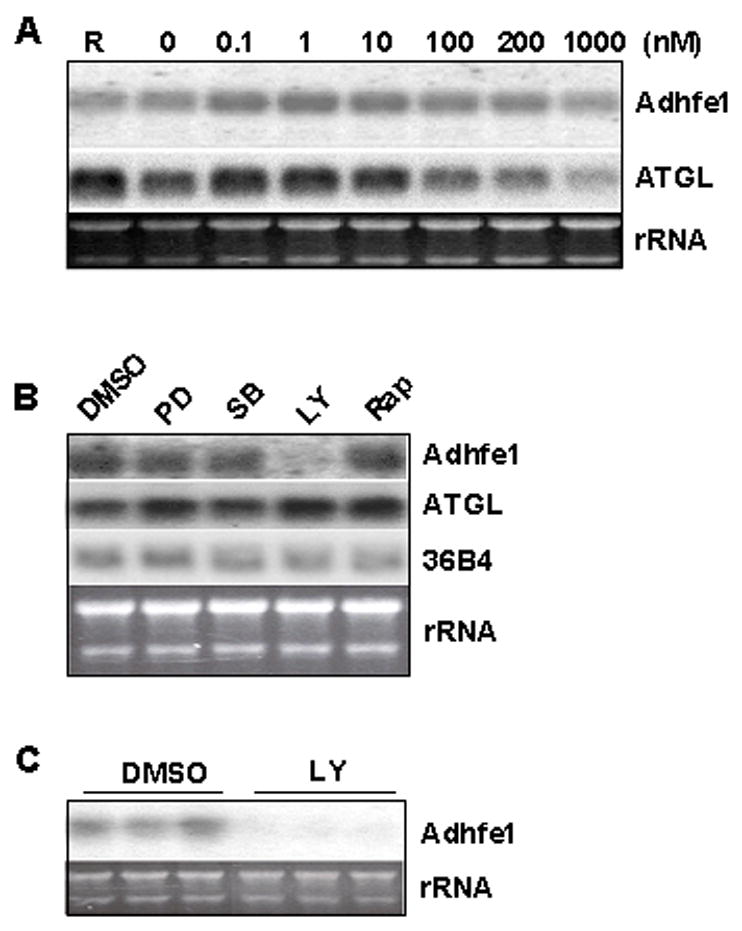
A: No effect of insulin on Adhfe1 transcript in 3T3-L1 adipocytes. 3T3-L1 adipocytes were incubated in regular growth medium (R) or in serum-free medium for 16 h, at which time serum-free cultures were further incubated with the indicated concentration of insulin for 36 h. 5 μg of total RNA was analyzed by Northern blot using Adhfe1 and ATGL probes. B: Downregulation of Adhfe1 by PI 3-kinase inhibitor. 3T3-L1 adipocytes were serum starved for 6 h and treated for 17 h with DMSO vehicle, PD98059 (PD, 50 μM), SB203580 (SB, 20 μM), LY294002 (LY, 50 μM), and rapamycin (Rap, 1 μM). 5 μg of total RNA was analyzed by Northern blot using Adhfe1, ATGL, and 36B4 probes. C: Validation of Adhfe1 downregulation through PI 3-kinase pathway. 3T3-L1 adipocytes were serum starved for 6 h and treated for 17 h with DMSO vehicle (DMSO) or 50 μM of LY294002 (LY). 5 μg of total RNA was analyzed by Northern blot using Adhfe1 probe. For A-C, the EtBr staining of rRNA is shown as a gel loading control. Northern blots are representative of n=2 for A and B, and the study in C was carried out in triplicate, as shown.