
Figure 7. Dysregulation of Adhfe1 Transcript Level in a Murine Obesity Model, ob/ob.
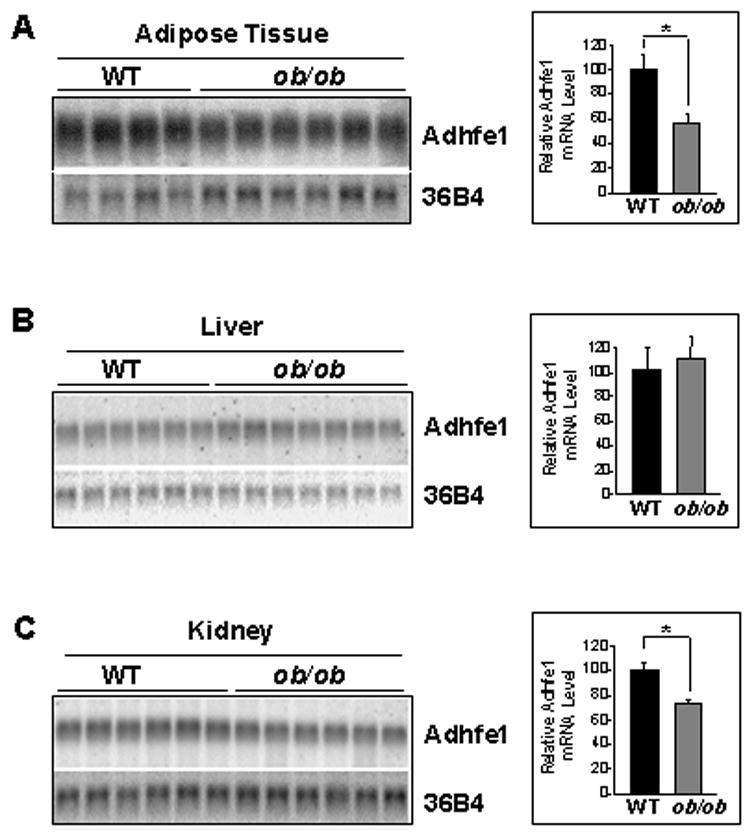
Subcutaneous adipose tissue (A), liver (B), and kidney (C) RNA were isolated from 8 wk old wild type C57BL/6 (WT) and ob/ob mice and subjected to Northern blot hybridization for Adhfe1 and 36B4 levels, quantitated by phosphorimager analysis, and Adhfe1 transcript level for each sample normalized against its 36B4 control. Data represent relative Adhfe1 level mean ± S.D. from multiple individual wild type mice (n=4 for adipose tissue, n=6 for liver and kidney) or multiple individual ob/ob mice (n=6 for adipose tissue and kidney, n=7 for liver) and were analyzed by single factor ANOVA (*, p<0.001).