
Figure 1. A Typical Example of Neural and Behavioral Variation.
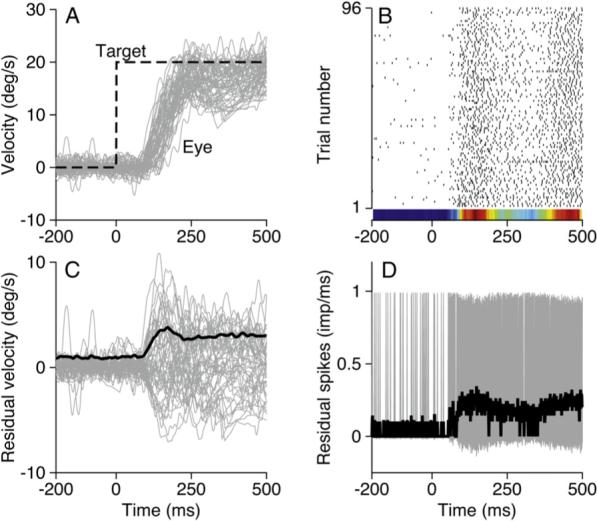
(A) The gray area shows superimposed eye movements in response to 95 presentations of identical target motion. The dashed black line indicates target velocity as a function of time.
(B) Raster showing the responses of a single neuron during the eye movements shown in (A); each black tick indicates one spike. The peristimulus time histogram is plotted as a colored strip below the rasters; red and blue correspond to the peak and nadir of activity.
(C) Gray area and black trace show the residuals of eye velocity derived from the data in (A) and their standard deviation as a function of time.
(D) The gray area and black trace show the residual spikes as a function of time and their standard deviation.