
Figure 2. The Covariation between Spikes and Eye Movements for an Example Neuron.
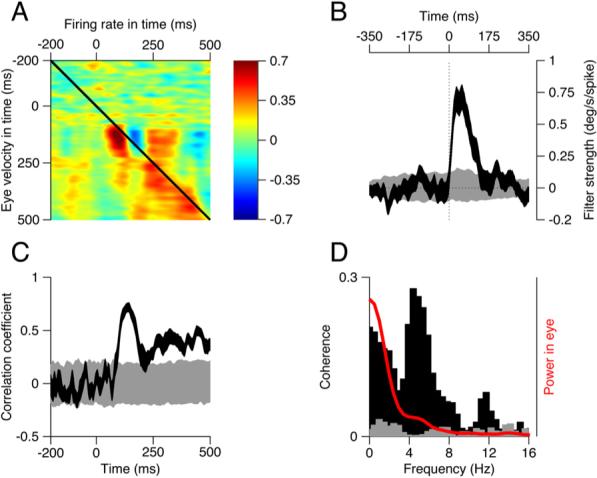
(A) The neural-behavior correlations as a function of time. Each pixel shows the correlation coefficient between the eye velocity and the firing rate at times given by the position of the x and y axes.
(B) The black trace shows the filter that describes the relationship between residual eye velocity and spikes as a function of time elapsed from a spike. Negative and positive values of time correspond to changes in eye velocity that precede or follow the spike. The gray trace shows the corresponding filter derived from shuffled trials. Filters are based on 40% of the trials.
(C) The black and gray traces plot the correlation coefficient between the actual and predicted residuals as a function of time, for the filters obtained from the actual and shuffled data, respectively. Correlations are based on the 60% of the data not used to generate the filter.
(D) The black and gray histograms plot the coherence of the normal and shuffled filters in (B) as a function of frequency. The red curve shows the normalized power in the residual eye velocity. The width of each ribbon shows the standard deviation derived from 150 draws from the data.