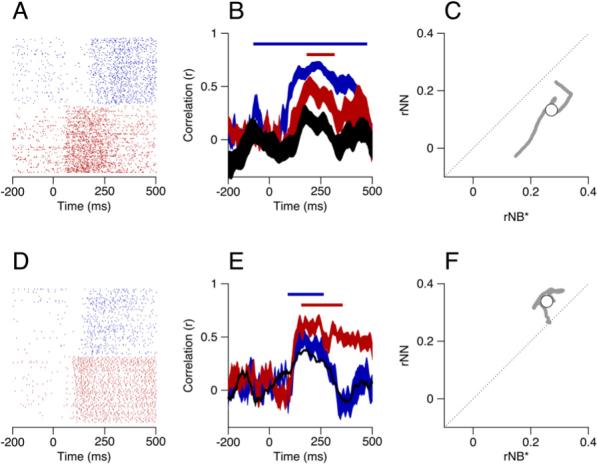
Figure 5. Correlations between Two Simultaneously Recorded Pairs of Units.

(A and D) Rasters showing the neural activity, where the two colors show responses of the two neurons in each example pair.
(B and E) The neuron-behavior correlation (rNB) and neuron-neuron correlation (rNN) as a function of time. Red and blue ribbons show the correlation between the actual residuals of eye velocity and those predicted from the spike train residuals and the filters for the two neurons. The black ribbon shows the trial-by-trial correlations between the predicted residuals of eye velocity for the two neurons. The ribbons show means ± one standard deviation; for clarity, only the mean is shown for the black trace in (E). The colored bars atop the functions correspond to the times where each rNB was 1.5 SD or more away from on the results of analysis based on shuffled trials.
(C and F) Comparison of the product of the neuron-behavior correlations for the two neurons in the each pair, rNB*, and the neuron-neuron correlations (rNN). Gray points plot the data for each individual time point, and open symbols show averages across the analysis interval.
