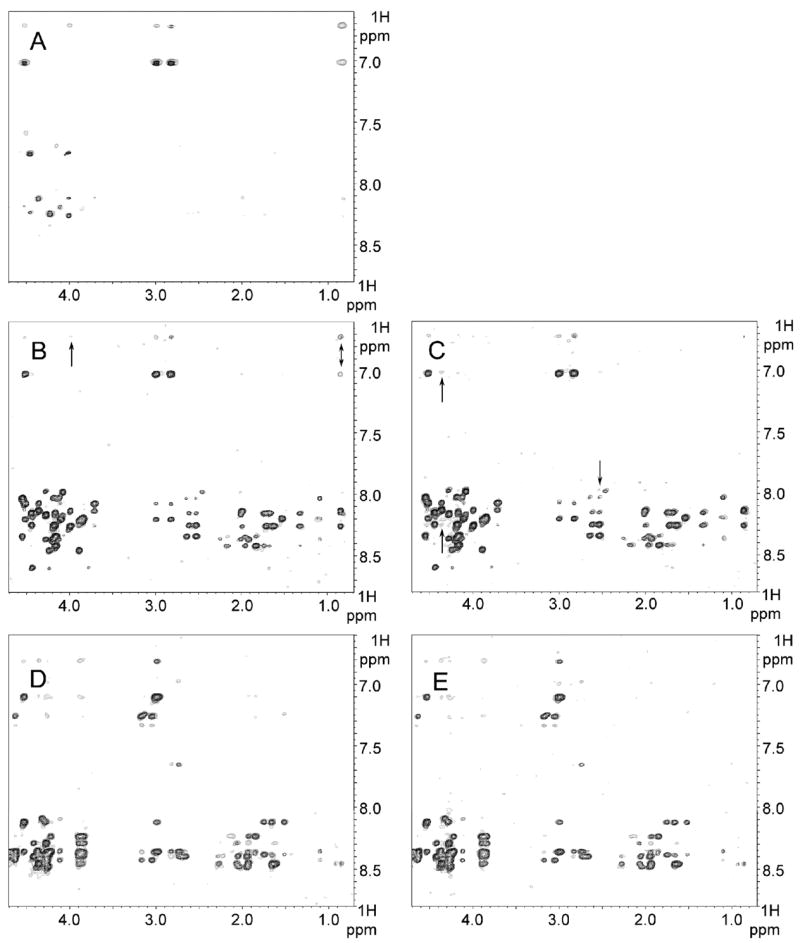
Figure 4.

Transferred NOE evidence for L1-CT motifs interacting with ezrin and AP2-μ2. All shown trNOE experiments were performed at 14 °C (400 ms mixing time) in 50 mM potassium phosphate (300 mM NaCl, pH 6.07) buffer. Superposition of NOESY spectra are presented as follows (peptide alone is shown in black; peptide in complex, in gray): (A) L1pept1A alone and in complex with the ezrin FERM domain at the ratio of 10:1; (B) L1pept1B alone and in complex with the ezrin FERM domain at the ratio of 15:1 with peaks originated from the major triad 151YSV marked by arrows; (C) L1pept1B alone and in complex with the AP2-μ2 chain at the ratio of 100:1 with new peaks originated from residues different from the 151YSV triad marked by arrows; (D) L1pept2B alone and in complex with the ezrin FERM domain at the ratio of 100:1; (E) L1pept2B alone and in complex with the AP2-μ2 chain at the ratio of 100:1.
