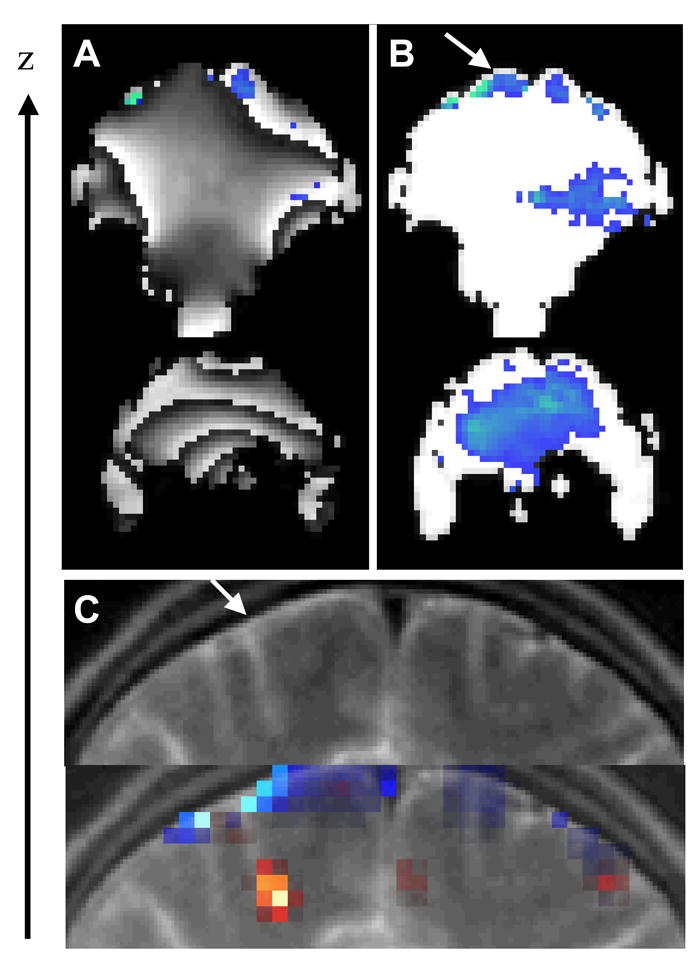
Fig 4.

A) Two GE-EPI coronal phase images of a subject’s brain and the corresponding phase activation pattern (blue) produced by the 2-back working memory task. Note the time-dependent wrapping artifact of the phase image minimizes statistical power of the activation. B) The “relative phase” images of the same raw data set have significantly higher statistical power for the detection of activation due to the elimination of wrapping artifacts. C) T2-wheighted coronal image of the superior frontal cortex showing a superior cortical vein (top panel; arrow) and the corresponding “relative phase” (blue) and “amplitude” (red) activation patterns produced by the 2-back task (bottom panel), superimposed to the structural image.
