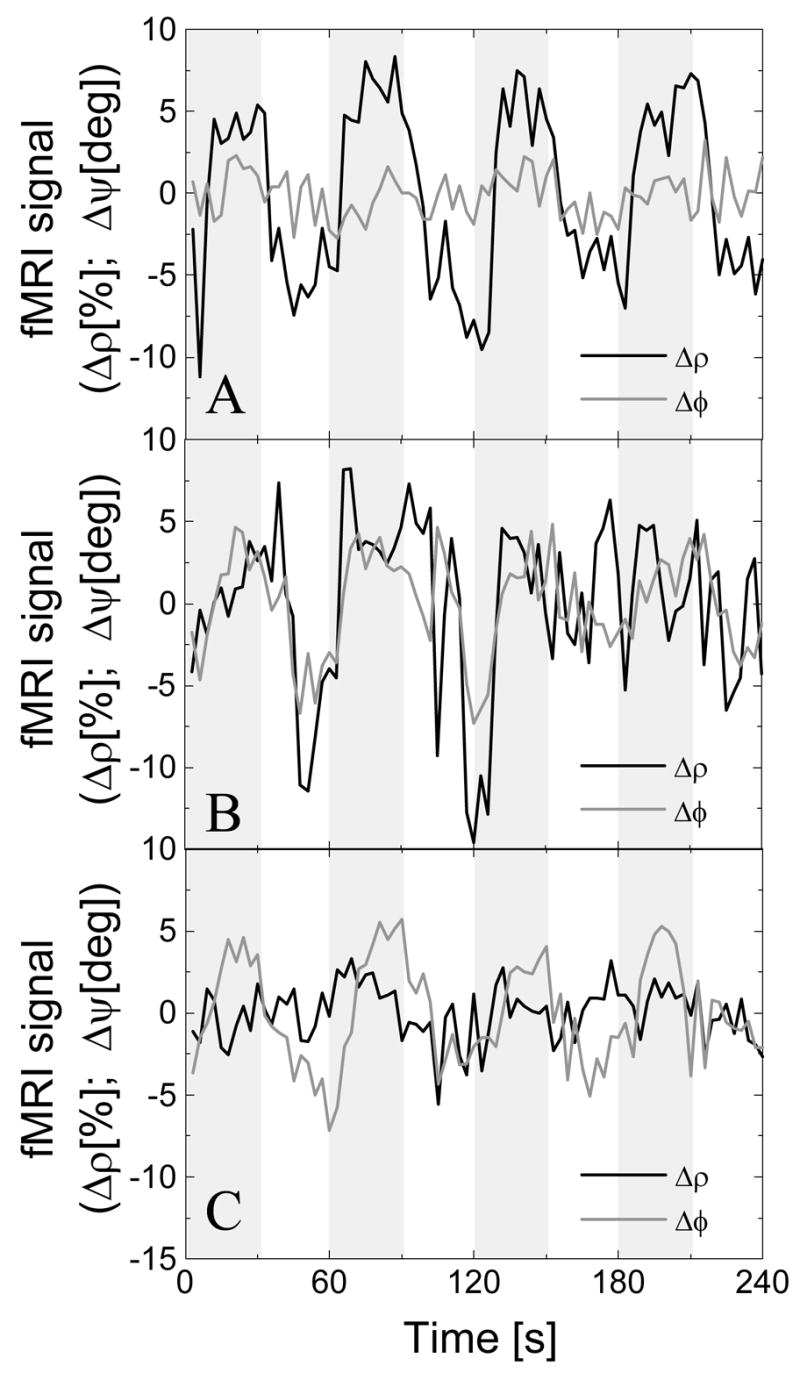
Fig 5.

“Amplitude” (solid line) and “relative phase” (gray line) signal time courses during the task for three different brain regions. A) The large (low) “amplitude” (“relative phase”) modulation is the typical response targeted in fMRI studies. B) Large both “amplitude” and “relative phase” modulations were indicative of significant macrovascular contributions. C) Voxels with large “relative phase” modulation and small “amplitude” modulation were mostly located in frontal regions near the sinus cavity; in this region, the fMRI signal change is prone to stimulus-correlated motion. Raw data without removal of physiological (respiratory) noise.
