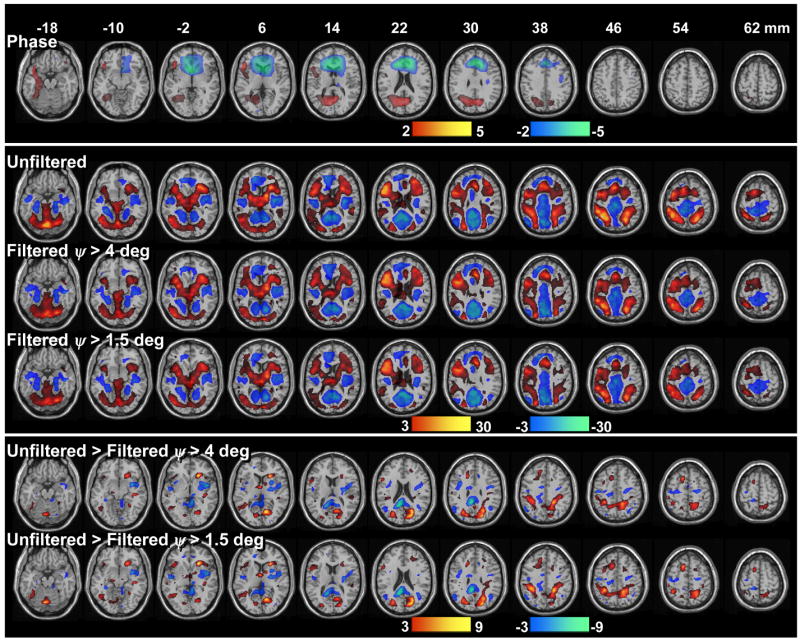
Fig 7.

Group analyses of brain activation produced by the 2-back working memory task (N = 18 subjects). Across subjects, the “relative phase” (top panel) activated the occipital and dorsolateral prefrontal and temporal cortices (red), and deactivated the rostral frontal regions near the sinus cavity. The proposed phase filtering method reduces statistical power in “amplitude” activation (red)/deactivation (blue) patterns (middle panel). The differential activation (bottom panel) patterns show the brain regions more affected by the proposed phase filtering method across subjects.
