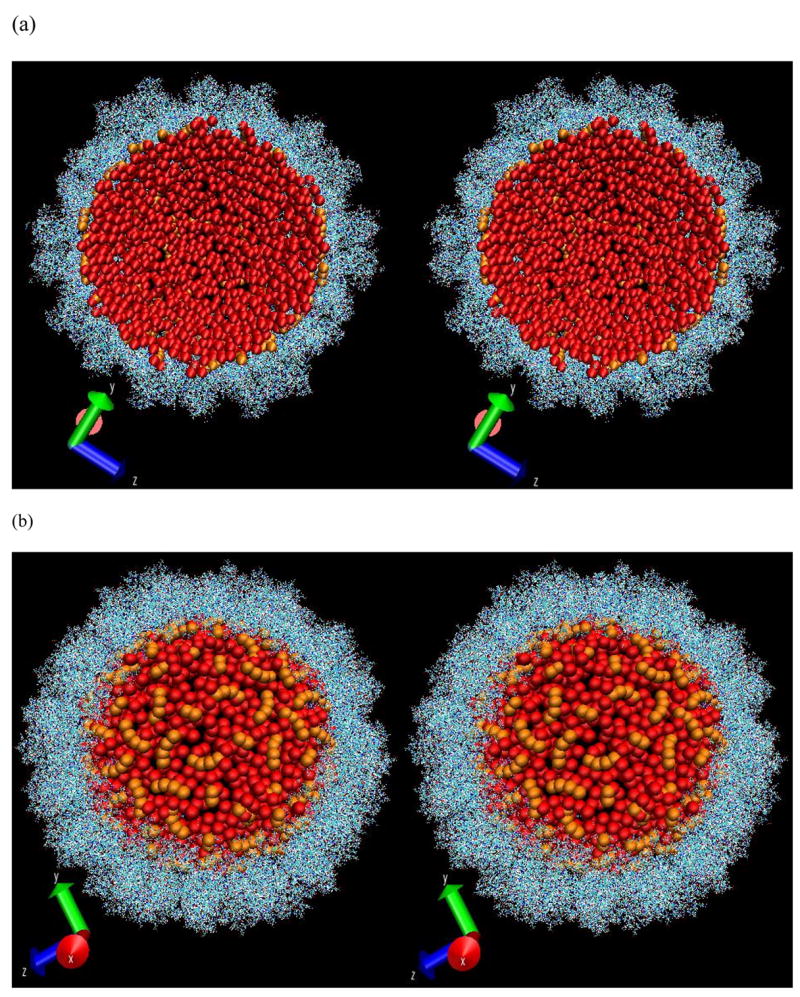
Figure 6.

The stereo-view of the distribution of RNA spheres (in red) from the final conformation with optimal energy as viewed from inside (a) and outside (b). The pre-existing RNA nucleotides are shown in orange. The capsid is shown in a line model. Part of the capsid in (b) was stripped to show the RNA more clearly.
