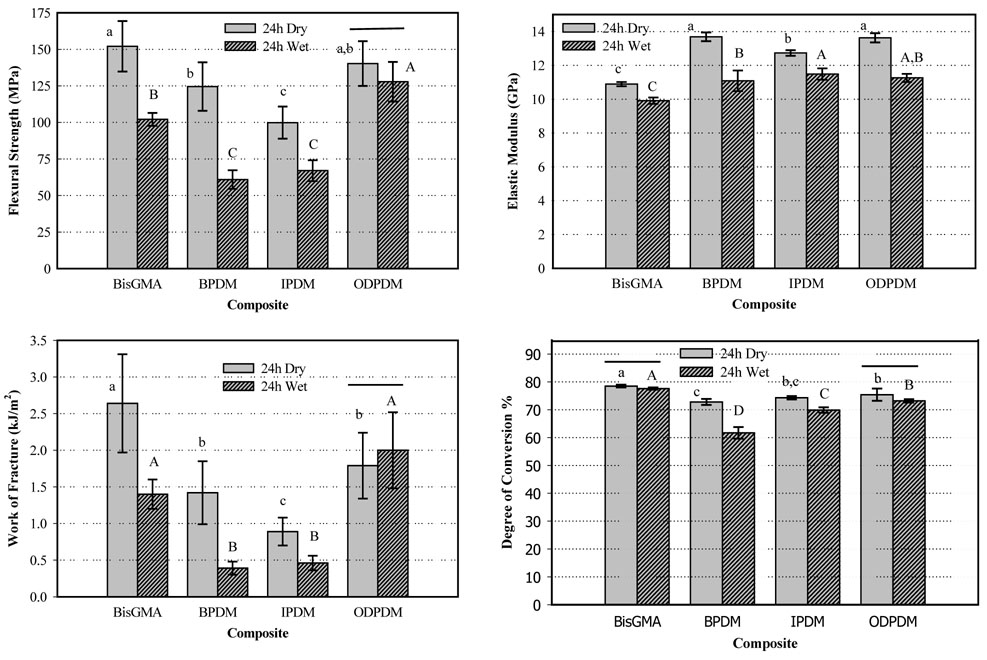
Figure 3.
Flexural strength, modulus, work of fracture and degree of conversion of composites stored dry or wet for 24 h. The horizontal bars indicate that no statistical differences exist between the wet and dry data. Lower case letters compare the dry data of a given property, upper case compare the wet data (2-way ANOVA, Holm Sidak, p < 0.05). The vertical bars represent the standard deviations.

