Figure 4.
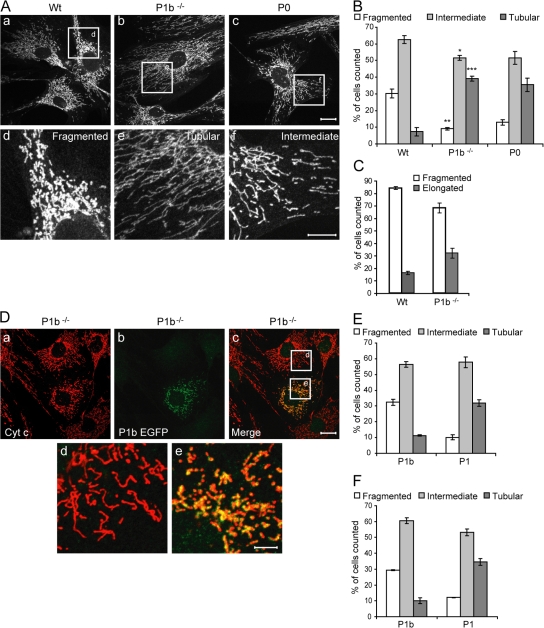
Morphology of mitochondria in wt, P1b−/−, and P0 fibroblasts. (A) Mitochondria of wt (a and d), P1b−/− (b and e), and P0 fibroblasts (c and f) were visualized using antibodies to cyt c. Morphologies were classified as fragmented, tubular, or intermediate, as exemplified in panels d, e, and f, which represent magnifications of the boxed areas shown in a, b, and c, respectively. Bars: (a–c) 20 μm; (d–f) 5 μm. (B) Morphologies of wt (n = 239), P1b−/− (n = 226), and P0 (n = 204) mitochondria (mean ± SEM). *, P < 0.05; **, P < 0.01; ***, P < 0.001. (C) Statistical evaluation of mitochondrial morphologies in primary myoblasts derived from wt (n = 238 cells) and P1b−/− (n = 253 cells) mice. Values represent mean ± SEM. (D) P1b−/− fibroblasts expressing P1b EGFP were immunolabeled using anti–cyt c and anti-GFP antibodies. Magnifications of boxed areas in panel c are shown in panels d and e. Note the reversion of the mitochondrial phenotype characteristic of P1b−/− cells in the transfected cell (e) but not in the adjacent untransfected cell (d). Bars: (a–c) 20 μm; (d and e) 10 μm. (E and F) Rescue efficiencies (mean ± SEM) determined by analyzing P1b−/− (E) or P0 cells (F) expressing P1b (n = 165 and n = 109, respectively) or P1 (n = 69 and n = 82, respectively).

