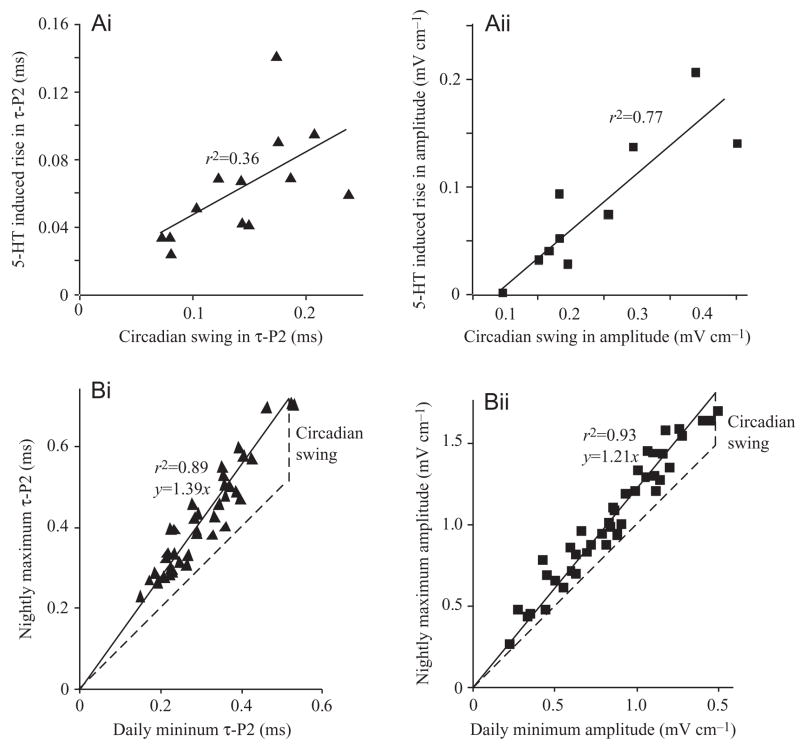
Fig. 10.
(A) The response of repolarization time (τ-P2) (Ai) and amplitude (Aii) to 5-HT doses ≥2.5 nmol g−1 varies as a function of the magnitude of the circadian swing. Thus individuals with large circadian oscillations in τ-P2 or amplitude were predisposed to increase τ-P2 or amplitude more when injected with 5-HT than were fish with smaller cycles. (B) Daily minima and nightly maxima of τ-P2 (Bi) and amplitude (Bii) are tightly correlated. Regression (solid) lines are forced through zero, and the unity slope (broken) line is shown for comparison. The difference between the solid regression line and broken unity slope line represents the day–night swing. Thus, the larger the baselines of τ-P2 or amplitude, the larger the nightly swings and the larger the responses to 5-HT.

