
Figure 2.
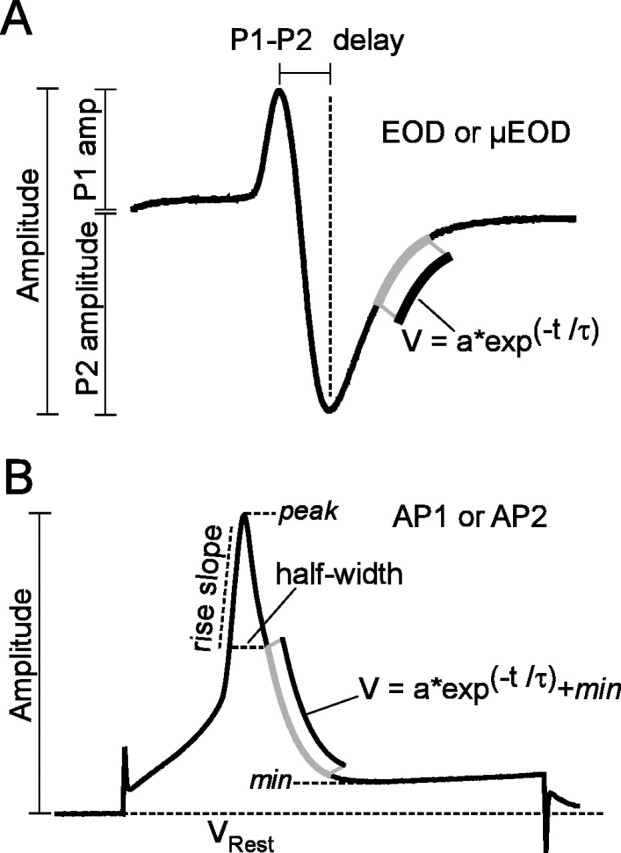
Measures of EOD, μEOD, and transmembrane AP waveform characters. A, Amplitude was measured peak-to-peak for the biphasic EOD andμEOD. P1 amplitude was measured from 0 mV to the peak of P1, and P2 amplitude was measured from 0 mV to the peak of P2. The time constant of P2 repolarization, τ, was estimated by an exponential fit to the repolarization segment of P2, and P1–P2 delay is the time between the P1 and P2 peaks. B, For transmembrane action potentials AP1 and AP2, we measured amplitude from resting potential to peak. Other measures were referenced to the spike amplitude from its maximum (peak) to the minimum potential recorded after the peak (min). Rise slope was measured from 50 to 90% of the min–peak amplitude, and half-width was measured as the spike width in milliseconds at 50% of the min–peak amplitude. The repolarization time constant τ was estimated by exponential fit to the repolarization segment of the spike from 50 to 5% of the min–peak amplitude.