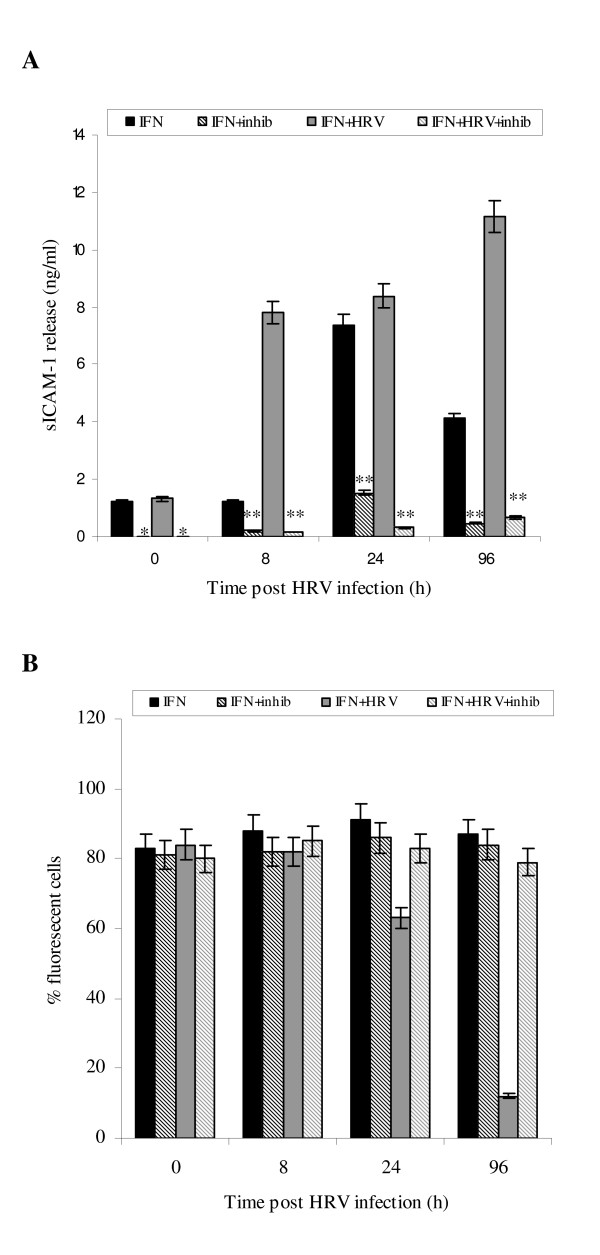
Figure 7.
Effect of protease inhibitors on sICAM-1 release (A) and mICAM-1 levels (B). Cell cultures were pre-incubated with 1 complete™ mini tablet/10 ml of media; sICAM-1 in associated supernatants was assayed using ELISA. Data are mean ± S.E. of three separate experiments (Fig. 7A, *p < 0.01, **p < 0.05, IFN-γ treated infected cells pre-incubated with protease inhibitors compared to equivalent untreated IFN-γ treated infected cells). mICAM-1 protein expression was measured using immunofluorescence. Data are mean ± S.E. of three separate experiments (Fig. 7B).

