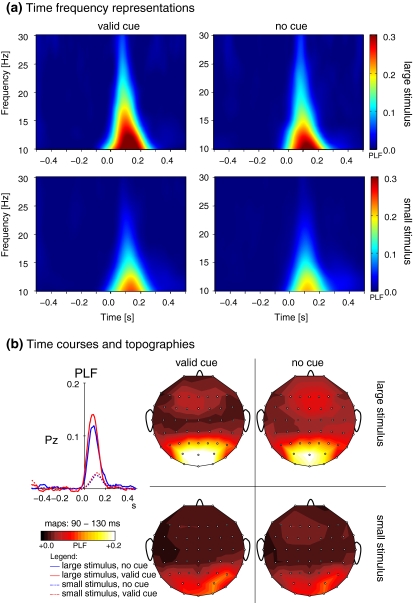
Fig. 6.
Early stimulus locking (PLF-values) in the β band. (a) Time frequency representations of stimulus locking in response to cued (left) and uncued (right) large stimuli (upper row) and small stimuli (lower row). (b) Time courses (left) and topographic maps of stimulus-locking in the β band. Maps are arranged in the same way as the time frequency representations in part (a). Note that the cue related increase in stimulus-locking is much more pronounced in response to large stimuli (solid lines/upper rows) than in response to small stimuli (dotted lines/lower rows)

