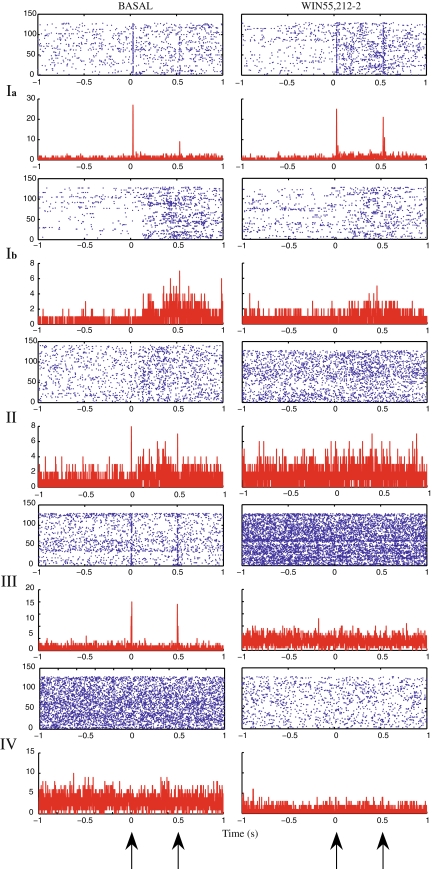
Fig. 4.
Perievent spiketrain raster plots and histograms (counts/bin, bin = 1 ms), shown in the upper-lower panels, respectively, of representative cells from each class. Left: control period. Right: following the administration of WIN55,212-2. Two types of response modes were observed for the cells from class I; either responding to both tones with a gated response to the test tone (subclass Ia), or having slightly elevated firing between the two tones (subclass Ib). Cells from class II had a small response following (C) but were not stimulus-locked. One representative cell is shown from the class III, which responded in equal manner to both (C)(T) tones. Class IV cells did not show any response to the two auditory tones. Following the administration of WIN55,212-2 group Ia cells responded equally to both tones failing to gate, and group III failed to respond to any of the two tones. The other groups did not exhibit a significant change

