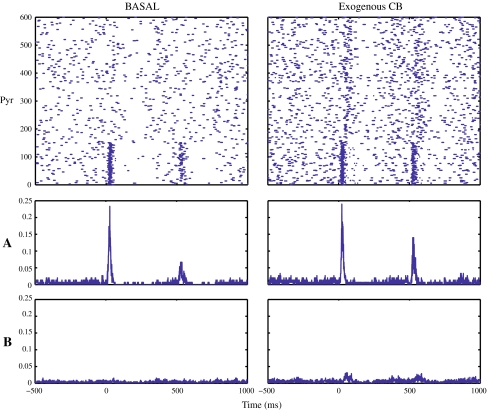
Fig. 6.
Perievent raster plots (top) and histograms of a representative single trial from the NEURON CA3 model during basal and after the administration of exogenous CBs (left–right panel, respectively). The lower two panels show perievent average firing rates (spikes/bin, bin = 1 ms) for two populations of pyramidal cells (n = 600) from the NEURON CA3 model. Group A represents the pyramidal cells (n = 150) which are directly contacted by the afferent input representing the two tones. Group B represents the pyramidal cells (n = 450) which are not directly activated from the input of the two tones

