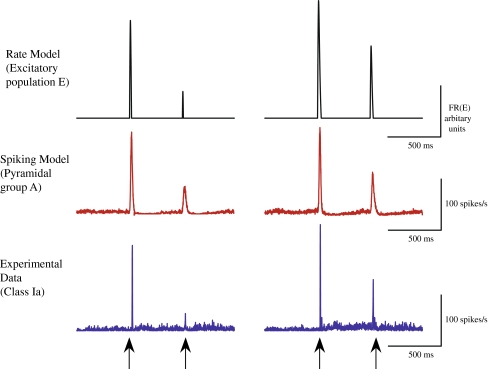
Fig. 8.
Control period (left) and following the administration of exogenous CBs (right). Upper panel: the output firing rate FR(E) of the excitatory population (E) in the rate model. Middle panel: the average firing rate of group A from the NEURON spiking model across all random trials (n = 20). Lower panel: the average firing rate of the cells from the subgroup Ia of class I across all trials

