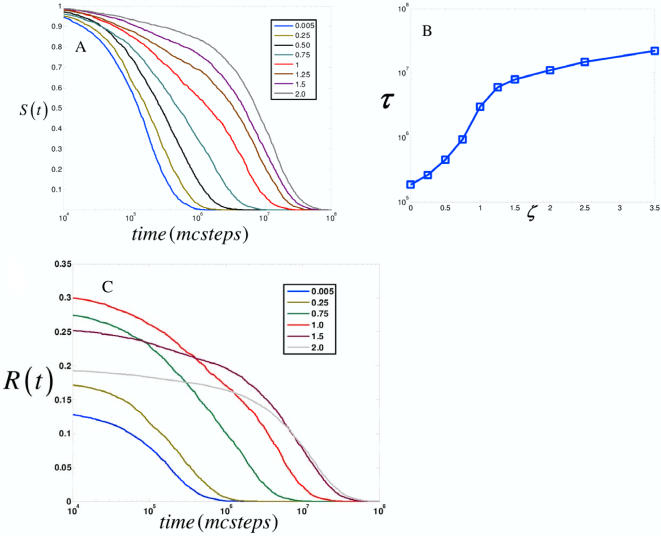
Figure 2. The concentration of scaffold proteins sets time scales for signal propagation.
(A) S(t) as a function of time for different values of relative scaffold concentration, ζ ( ). ζ ranges from 0.005 to 2 times the optimal value. (B) The characteristic time scale τ (S(t = τ) = e
−1) is extracted from the curves in (A), and its variation with ζ is shown. Two regimes are observed and are separated by an inflection point. (C) Integrated signal flux R(t) for different values of ζ.

